When it comes to site speed and performance, there’s a lot to consider. Web applications usually include many elements, from images and text to buttons and widgets. All these elements contribute to how quickly – or slowly – your site loads. However, one of the most significant factors impacting a site’s speed and performance is its Largest Contentful Paint (LCP). The better your LCP is optimised, the better your site’s overall performance. At Lightflows, we use the latest technologies to ensure our software development partner’s product is well-optimised, including its LCP.
LCP is a metric that forms part of the Google Chrome User Experience Report (CRuX). And it’s a very important metric at that – especially when it comes to customer experience. Thanks to our mobile-first world and increasing thirst for instant gratification, customers have higher expectations when using your online services. Essentially, you have just milliseconds to capture their attention. The quicker your site, the less time they wait, leaving them satisfied and happy to continue navigating your services. The slower your site, the more time they wait, urging them to leave – and costing you a potential lead.
As such, on top of eye-catching design and excellent content, a site’s quality is now largely determined by speed and performance. However, how to go about fixing issues with these metrics is not always clear. Using tools like Chrome’s DevTools, we can not only diagnose the issues but also measure and optimise them. This blog explains how to use Chrome’s DevTools to diagnose, measure and fix your site’s LCP, but not before explaining LCP and its importance to your site.
What is Largest Contentful Paint (LCP)?
A site or webpage’s Largest Contentful Paint (LCP) is the element that uses the most amount of pixels. In other words, it refers to how long a large piece of content takes to paint (or render). LCP is one of the three Core Web Vitals metrics that score a user’s webpage loading experience. The LCP usually takes the form of a webpage’s header or ‘hero section’ – the first element users see when they land on your page.

You can gauge how well a site is optimised by measuring its LCP. A low LCP score usually means it’s well-optimised and loads quickly, encouraging users to stay and continue using your site. A high LCP score, on the other hand, means the website needs improvement. If left unoptimised, a high LCP can lead to higher bounce rates and – ultimately – fewer leads.
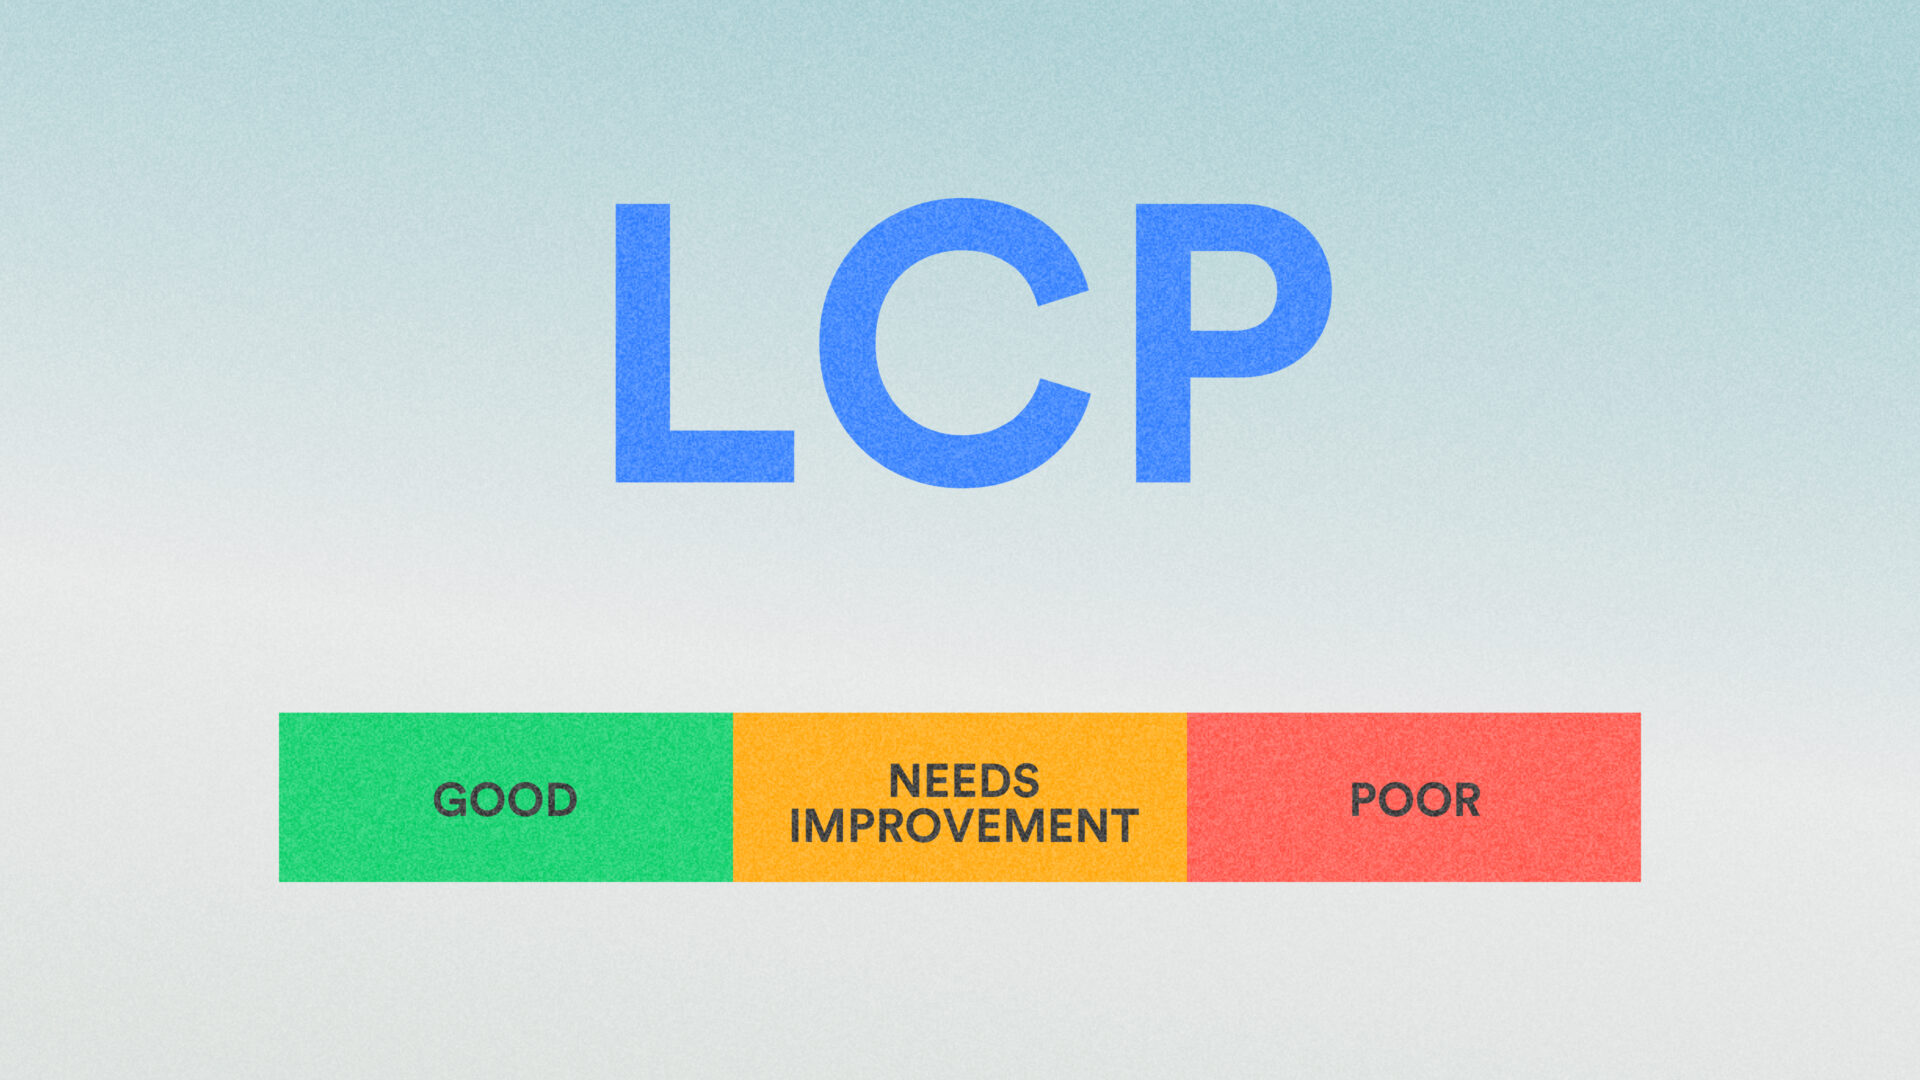
What is a good Largest Contentful Paint (LCP) score?
An ideal LCP score is anything under 2.5. That is, if the LCP takes less than 2.5 seconds to load, you’ve got yourself a good LCP score. If it takes longer than 2.5 seconds, we recommend making some changes to optimise your LCP. We explain how to work out how long your LCP takes to load below.
How to measure Largest Contentful Paint (LCP)
To measure your LCP, you first need to determine the biggest element on your site. If you don’t have a hero section, it could be an image, widget or another prominent feature. You can quickly determine your site’s biggest element using tools like PageSpeed Insights, where you can enter any URL, and it’ll conduct a full performance test, including the LCP. Whichever element yields the highest number of seconds between the first byte and the first paint event of the webpage reports as the LCP for that URL.
Diagnosing and fixing LCP issues using Chrome’s Performance Tab
Diagnosing and fixing LCP issues can be time-consuming and confusing. Sometimes, it feels like you’re chasing your tail and unobtainable goals, especially when working on a legacy site. Whilst many tools give a high-level overview of LCP issues, we’ve found that sometimes, the only way to uncover what’s happening is to get into the very low-level detail of your site. This means profiling code at a functional level. To help with this, we use Chrome’s Performance Tab from DevTools, Google Chrome’s built-in set of web development tools.
If you want to try recording LCP using Performance Tab yourself, we recommend using Incognito Mode to prevent other browser extensions from interfering. We also recommend adjusting some settings to ensure it renders as accurate a result as possible. For example, we first suggest ticking the Screenshots and Web Vitals checkboxes. Then, we recommend selecting ‘Fast 3G’ under the Network tab. Finally, you should choose ‘4x slowdown’ under CPU to account for load times on older devices.
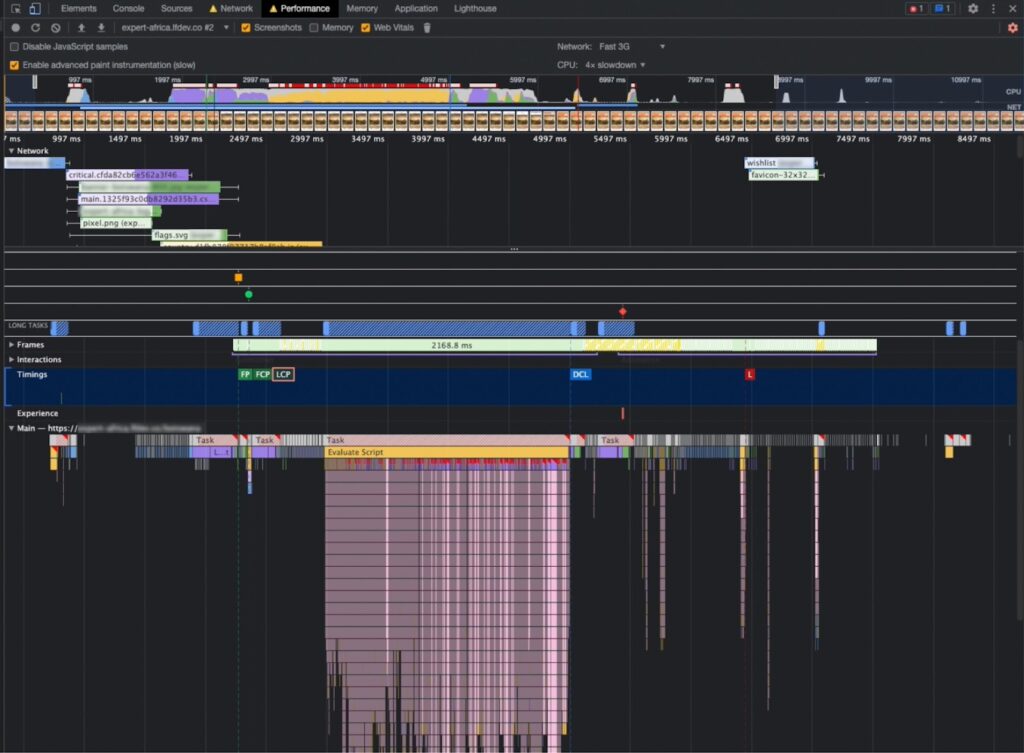
Once you’ve adjusted the settings, you can now start measuring your LCP. To do this, click the ‘refresh’ button in the top left corner.
The page should now reload and start recording all the webpage’s actions. This process usually takes around 30 seconds.
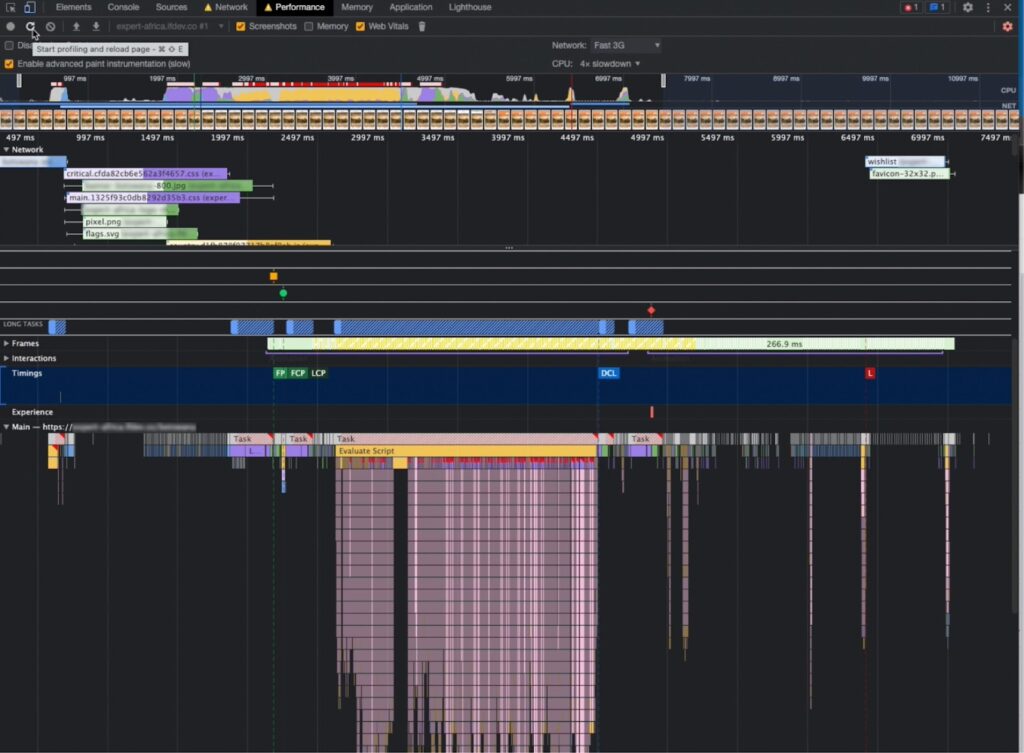
Once the page has reloaded, the LCP score will show in the ‘Timings’ lane. For example, in the image above, you can see that the LCP appears in under 2497 milliseconds (roughly 2.5 seconds) – a solid LCP score.
In the ‘Main’ lane, the page will also present several graphs, including big, scary-looking ones called Flame Graphs (but they’re not as scary as they look!). Essentially, these graphs tell you how long the page takes to script and render elements such as the LCP.
You can zoom into the flame graphs to gain a deeper insight into what’s impacting the LCP score. They visualise the state of your code’s JavaScript stack at every millisecond during the performance profile, with each function stacking below the previous one – hence the upside-down ‘flames’. This tells you precisely which functions were executed and when, where from and for how long.
How to improve Largest Contentful Paint (LCP)
Several elements of a webpage can impact its LCP score. If your LCP is higher than you’d like it to be, some of the most impactful ways you can improve it include:
- Reducing the server logic. Ensure the Content Management System (CMS) that your site lives on has long-lived caching headers for static files, such as images, stylesheets and scripts, to speed up serving.
- Using a content delivery network (CDN). We always recommend using a CDN: a geographically distributed network of servers that work together to deliver high-performing internet content. CDNs help to ensure that all assets of your webpage such as HTML pages, JavaScript files and stylesheets, as well as static files like images, transfer to the user quickly.
- Checking the front-end code. If your LCP appears in the initial viewport, like hero sections, it’s essential to ensure this part renders as quickly as possible. Deferring elements the page isn’t using from the front-end code, like scripts and style sheets, can help to improve the overall LCP.
Summary
Speed and performance have become increasingly vital factors in delivering a seamless web user experience. You can significantly improve these metrics on your site by measuring and optimising its LCP, thereby increasing customer satisfaction. Our recommendations for optimising your LCP using Chrome’s Performance Tab in this blog should help get you started improving your site’s performance.
If you have any questions or want to learn more about measuring and optimising LCP, get in touch, and we’ll be happy to arrange a call with you.